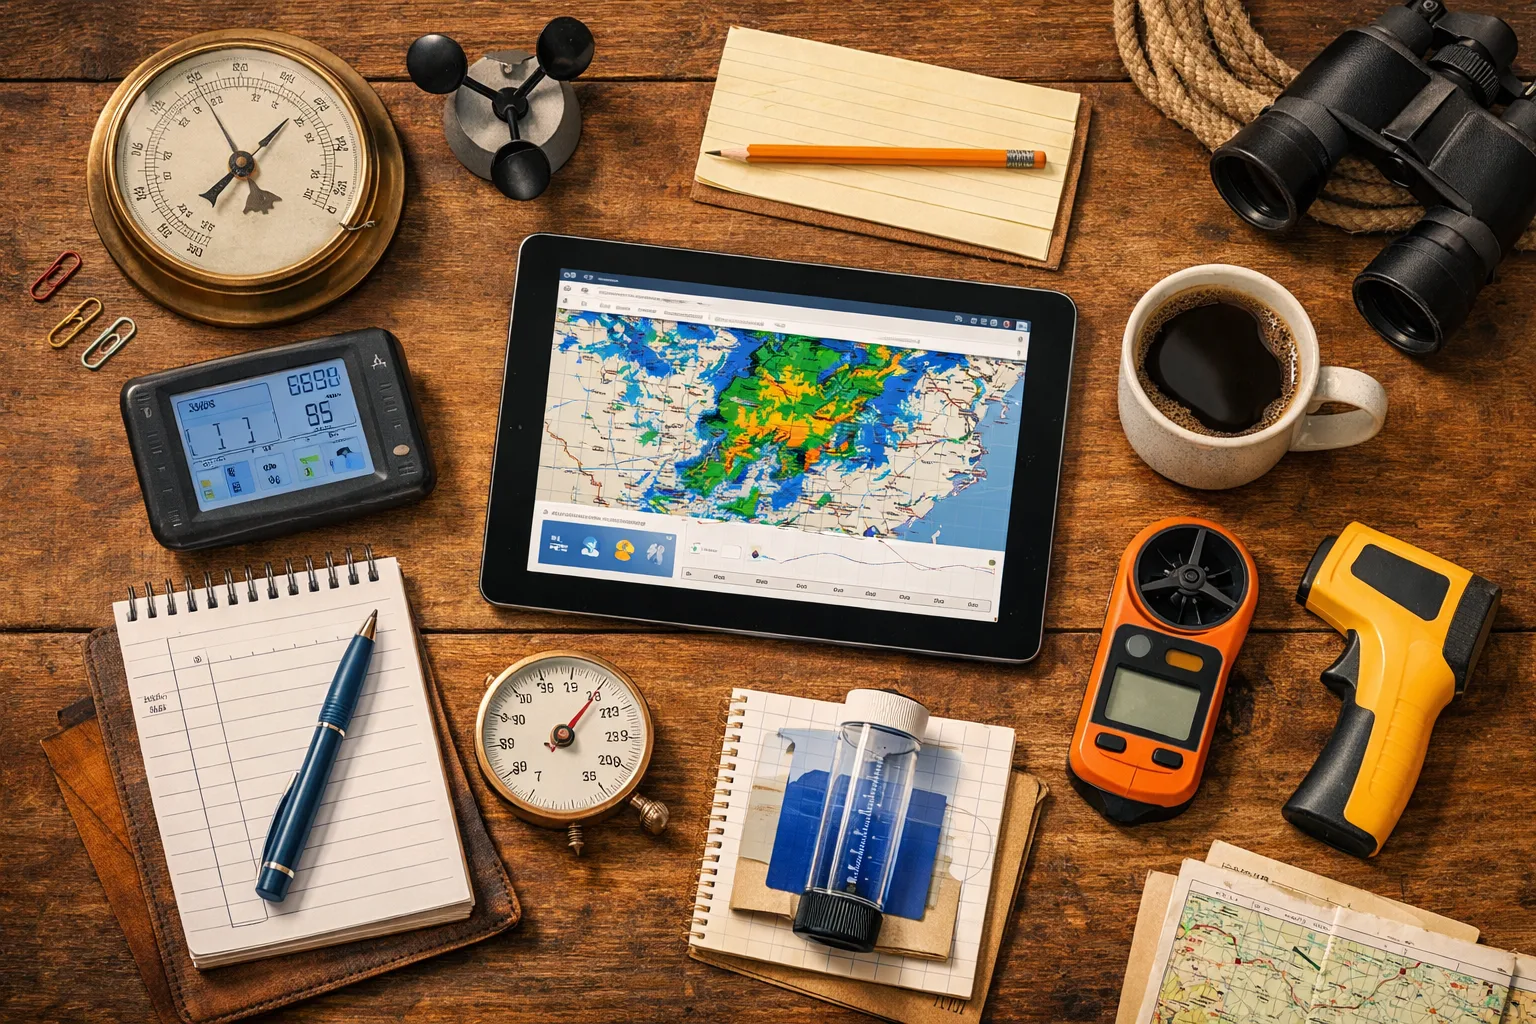
Weather is the one science topic that arrives at your door every morning. Your child does not need a lab or a kit to study it, just a few household items and the patience to look at the sky at the same time each day. Add readings from the National Weather Service and the project grows into a lesson in measurement, comparison, and graphing that fits grades 2 through 5 equally well.
Gather your tools
You can build almost everything from what is already in the house. Here is a short list:
- An outdoor thermometer, either a simple liquid one or a digital model with a probe.
- A straight-sided clear container, such as a clean tall jar or a cut-off plastic bottle, to use as a rain gauge.
- A ruler marked in inches and, for older kids, tenths of an inch.
- A permanent marker and some waterproof tape.
- A notebook or a sheet of graph paper on a clipboard.
To mark the rain gauge, tape the ruler to the outside with the zero at the bottom of the container, or pour in a little water so that the bottom is flat and measure from there. Place the gauge in an open spot, away from the eaves of the house, trees, and fences, which can funnel extra water in or block rain. Press it into the ground or set it in a bucket so a gust of wind cannot knock it over.
For temperature, put the thermometer in the shade about 4 to 6 feet (1.2 to 1.8 m) above the ground, on a fence post or a pole on the north side of the house. Direct sunshine will make it read too high, and a thermometer on a hot brick wall will not tell you what the air feels like.
A daily routine that fits in five minutes
Pick one time, such as right after breakfast or just before the school bus. Consistency matters more than the exact hour. Each day, your child records:
- The date and the time of the reading.
- The temperature in degrees Fahrenheit.
- The rainfall in the gauge, then empties it.
- A sky description in their own words: clear, partly cloudy, overcast, foggy.
- One observation about wind, such as “flags moving,” “leaves shaking,” or “still.”
Younger children can draw a sun, a cloud, or raindrops instead of writing a description. Older children can add cloud types if you have borrowed a picture guide from the library.
Compare with official readings
Once a week, sit down together and look up the official conditions for your area on the National Weather Service site. Type in your zip code, and the page shows current observations and a forecast. The National Weather Service is part of NOAA, the National Oceanic and Atmospheric Administration, and its readings come from calibrated instruments at airports and other official stations.
Ask your child to compare the numbers. Is the official temperature higher or lower than ours? By how much? Why might the numbers be different? A good answer might involve distance from the station, the time of day the reading was taken, or where the thermometer sits. Do not worry if the numbers do not match exactly. The point is to discover why a backyard reading and a station reading can differ, and what that teaches about measuring carefully.
Rainfall can differ quite a bit even a few miles apart, especially during summer thunderstorms, so a mismatch there is normal and a good talking point.
Turn the month into a graph
At the end of four weeks, have your child make a simple graph. A line graph of daily high temperatures is a good start: days along the bottom, degrees up the side, and a dot for each reading connected by lines. A bar graph works well for rainfall, with one bar per rainy day.
Then ask questions the graph can answer:
- What was the warmest day? The coolest?
- How many days had measurable rain, and what was the total in inches?
- Did the temperature rise or fall after a rainy day?
- If you guessed tomorrow’s temperature from this graph, what would you say, and why?
The last question is the beginning of forecasting. Let your child make a prediction each evening for a week, then check it the next morning. They will quickly develop respect for the meteorologists who do this for a living.
For more graph practice and other number-based projects, take a look at the math at home section. A month of weather notes also makes a fine writing sample, since a child can summarize it in a short paragraph at the end.
Leave a Reply